
Reports
Every sent campaign has its own report: how many people opened and clicked, who unsubscribed, which links they clicked and where they read the email. On the Custom reports page you can also compare several campaigns, by campaign or over time.
Opening a report
Section titled “Opening a report”Open Campaigns in the left menu and stay on the Sent tab. Each campaign card shows the four key numbers (Recipients, Opened, Clicked, CTOR) and a View report button. Clicking the campaign name opens the report too.
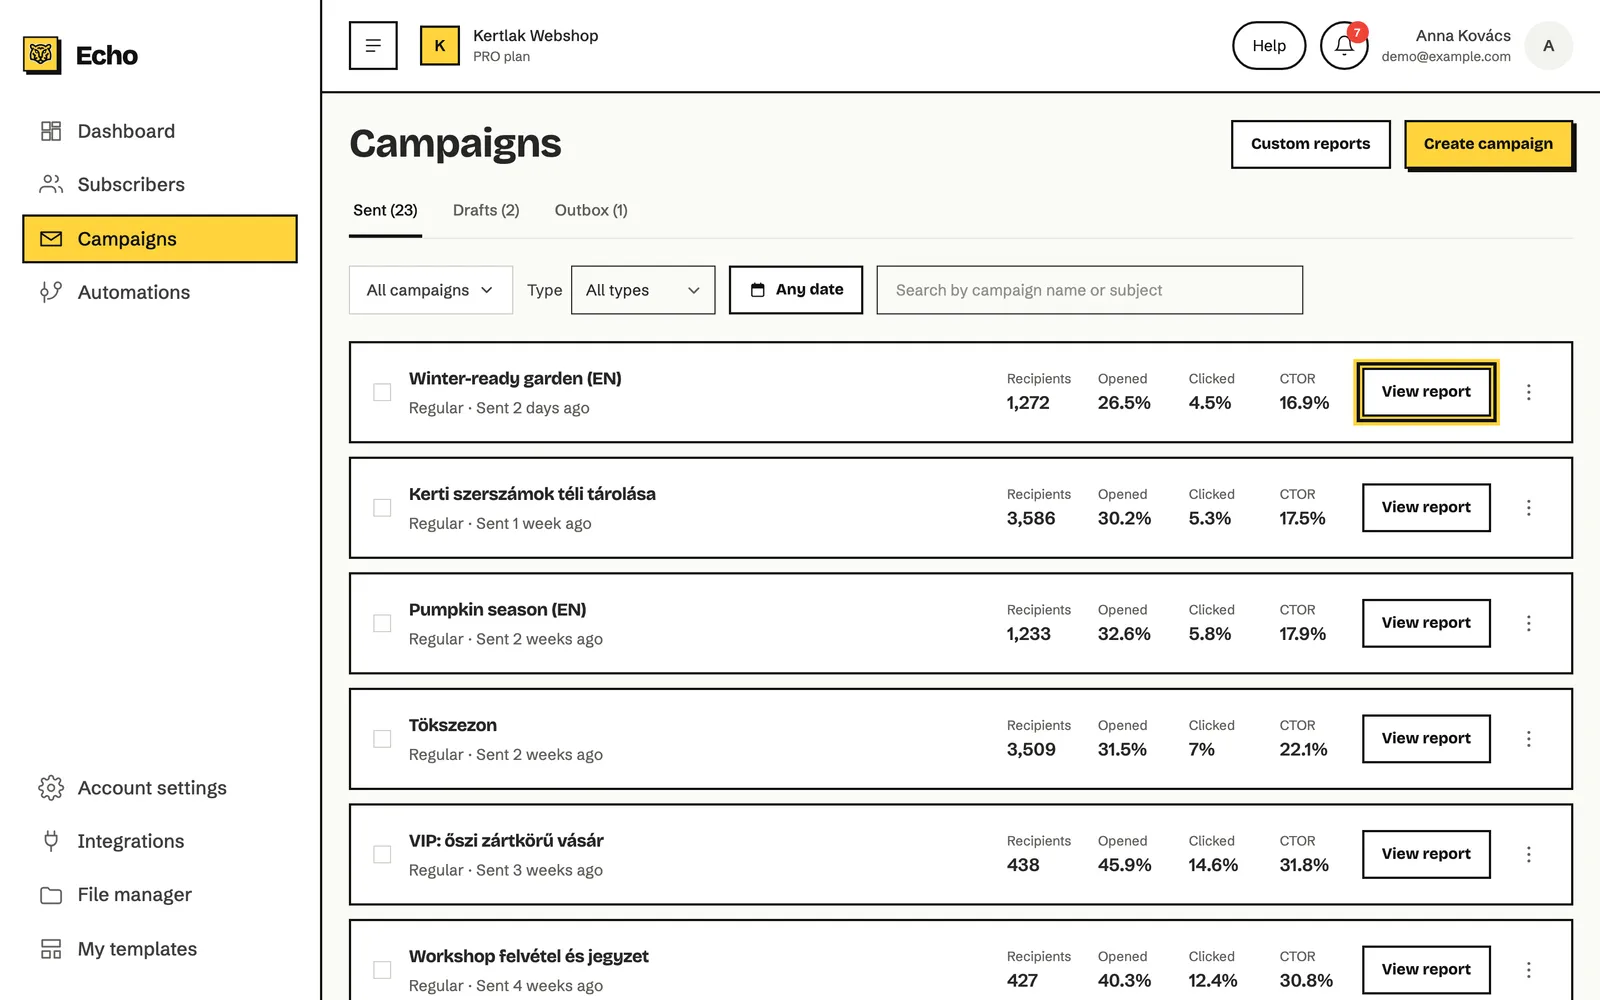
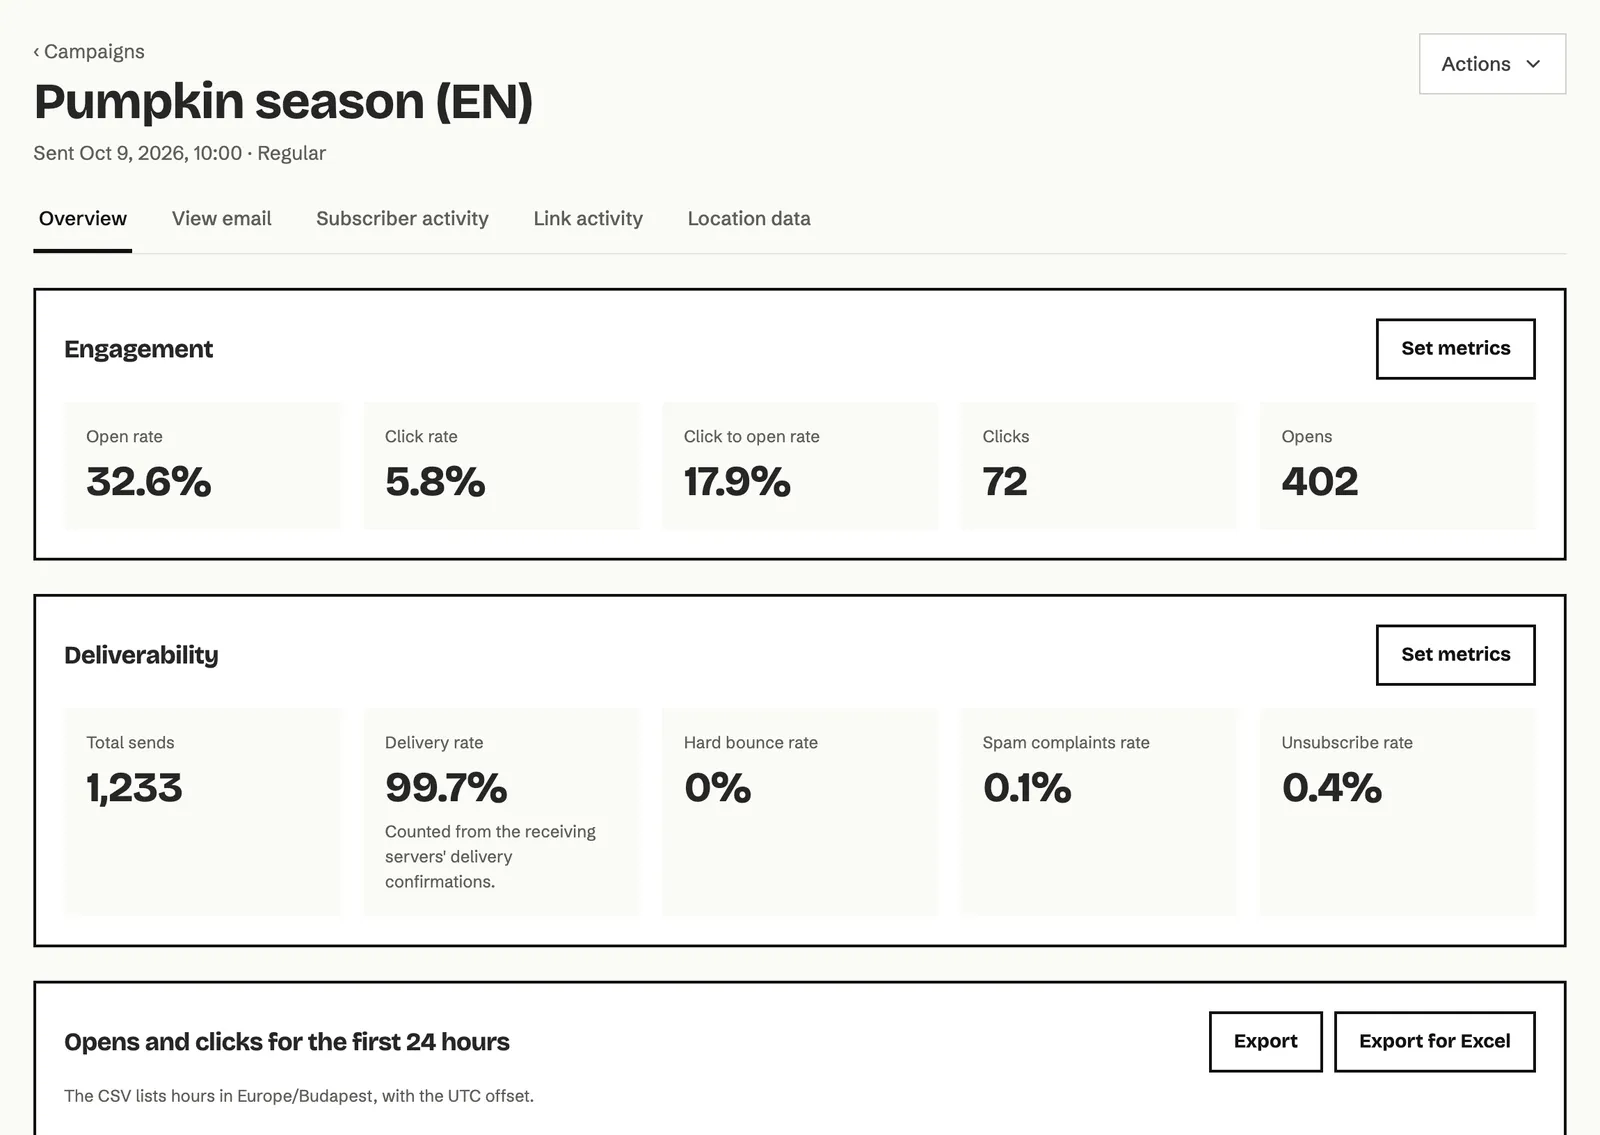
The report is there as soon as sending starts, so you can follow a campaign that is still going out. The header shows when the campaign was sent and its type (for example Regular or A/B split).
The report tabs
Section titled “The report tabs”The tabs at the top of a report always come in the same order. Some tabs appear only when they apply to the campaign.
| Tab | What it shows |
|---|---|
| Overview | The key metrics, the first 24 hours chart, reading environment, email clients, top links, unsubscribe reasons and recipients. |
| Auto resend overview | Auto resend campaigns only: the first and the second email side by side. |
| A/B split | A/B split campaigns only: the results of each version and the winner. For a multivariate test the tab is called Multivariate. |
| View email | The details of the email that was sent, its preview and the click map. |
| Subscriber activity | Per subscriber: who received it, who opened, who clicked, who unsubscribed and whose address bounced. |
| Link activity | Every tracked link in the email with its clicks. |
| Responses | Only when the email has a survey, quiz or event block: the answers that came in. |
| Location data | Opens and clicks by country, on a map and in a table. |
What the numbers mean
Section titled “What the numbers mean”Echo compares every rate with Total sends, the number of emails that actually went out. The exception is Click to open rate, which compares with the openers.
| Metric | What it means |
|---|---|
| Opens | How many subscribers opened the email at least once. Someone who opened it several times counts once. |
| Open rate | Openers divided by Total sends. |
| Clicks | How many subscribers clicked at least one link in the email. Someone who clicked several times counts once. |
| Click rate | Clickers divided by Total sends. |
| Click to open rate | Clickers divided by openers (shown as CTOR in the list). It tells you how many of the people who opened went on to click. |
| Unique and Total | Where both appear (for example Unique clicks and Total clicks), unique counts subscribers and total counts every single open or click. |
| Total sends | How many emails actually went out. |
| Deliveries, Delivery rate | How many emails the receiving servers confirmed as delivered, and what share of total sends that is. |
| Hard bounces | How many addresses can’t receive email at all. These addresses become Bounced and go on the suppression list. |
| Soft bounces | How many emails were temporarily not delivered, for example because the mailbox was full. |
| Spam complaints | How many recipients marked the email as spam in their mail app. |
| Unsubscribed | How many recipients unsubscribed from this email. |
| Forwards | How many times the email was forwarded with the forward link in the email. |
How to read the Overview tab
Section titled “How to read the Overview tab”-
Open the campaign’s report. The Overview tab opens.
-
The Engagement and Deliverability sections at the top show the key numbers.
-
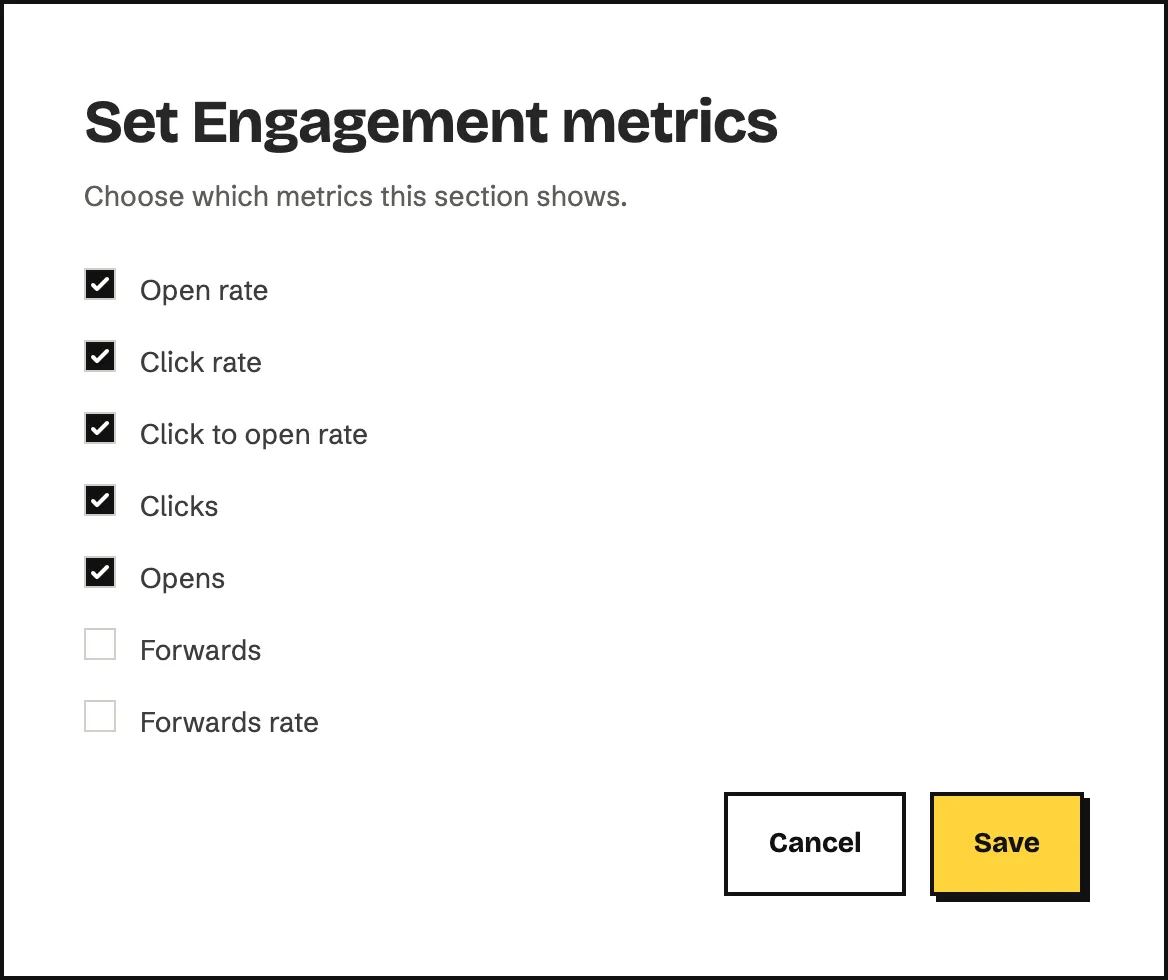
To see other metrics, click Set metrics in that section, tick the metrics you want and click Save.
-
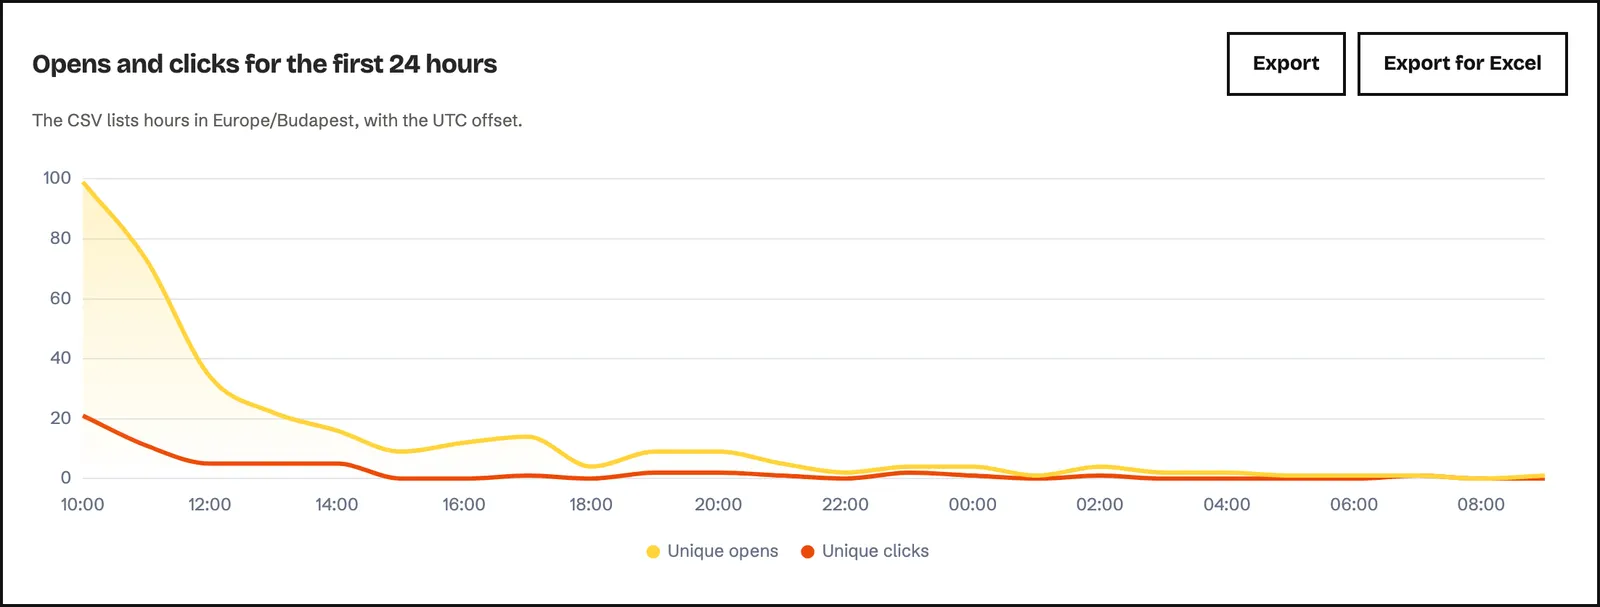
The Opens and clicks for the first 24 hours chart shows unique opens and unique clicks hour by hour, starting from the sending hour. Export and Export for Excel save the hourly data as a CSV file.
-
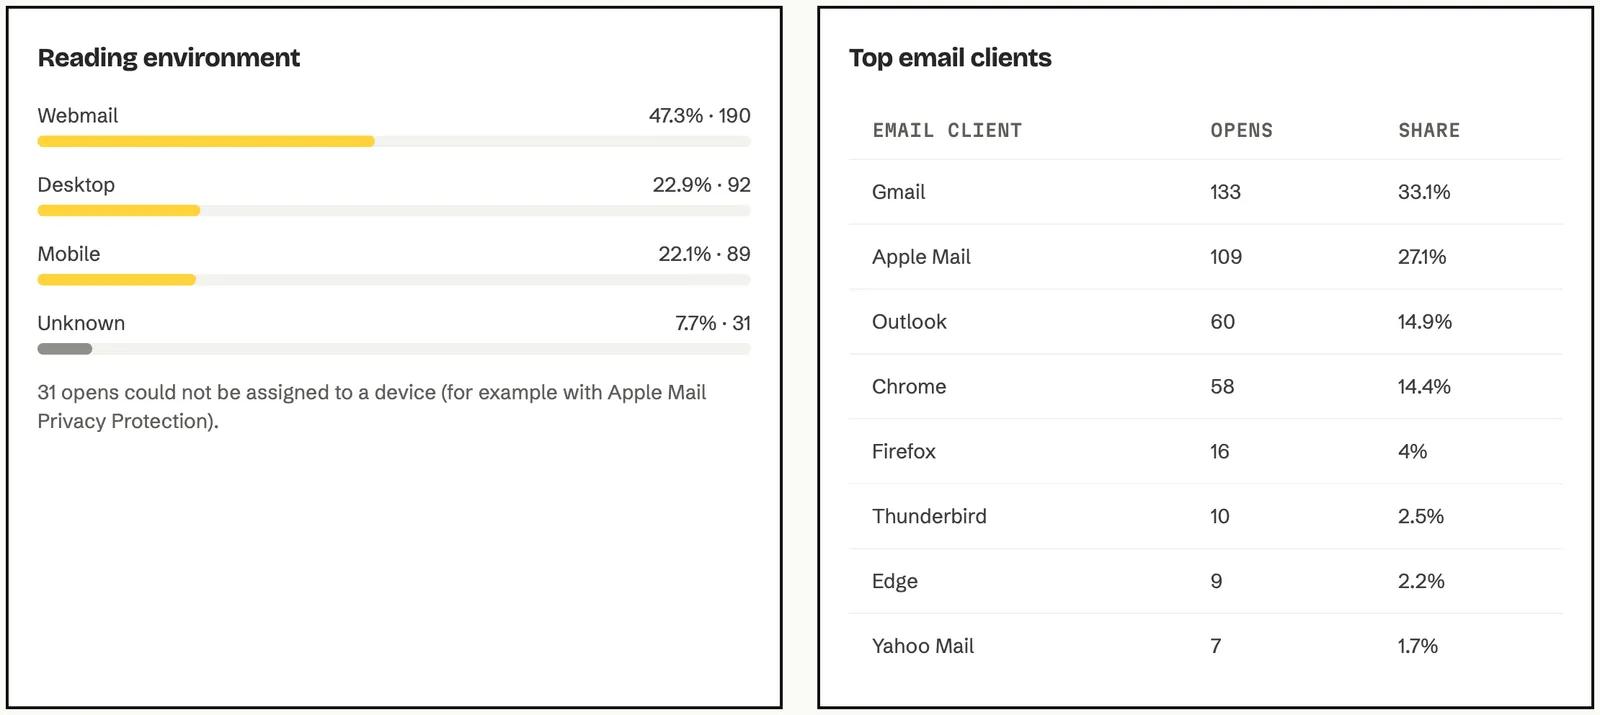
The Reading environment card shows what share of opens happened in webmail, desktop mail apps or on mobile. The Top email clients table lists the ten most used email clients.
-
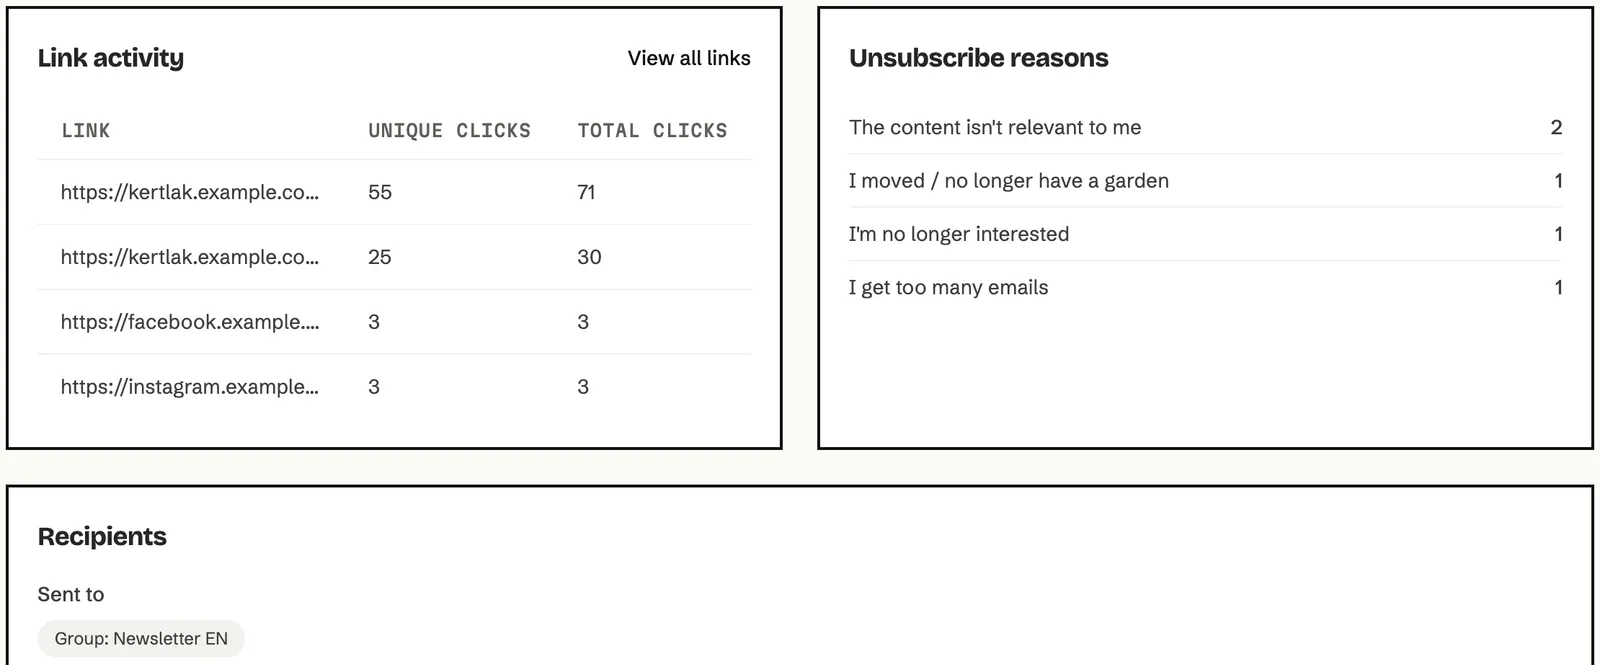
At the bottom, the Link activity card shows the top links, Unsubscribe reasons shows what people chose when they unsubscribed, and Recipients shows who the campaign went to.
How to see what each subscriber did
Section titled “How to see what each subscriber did”The Subscriber activity tab shows what happened with the email for each recipient. This is also where you find the unsubscribes, bounces and spam complaints.
- Open the Subscriber activity tab of the report.
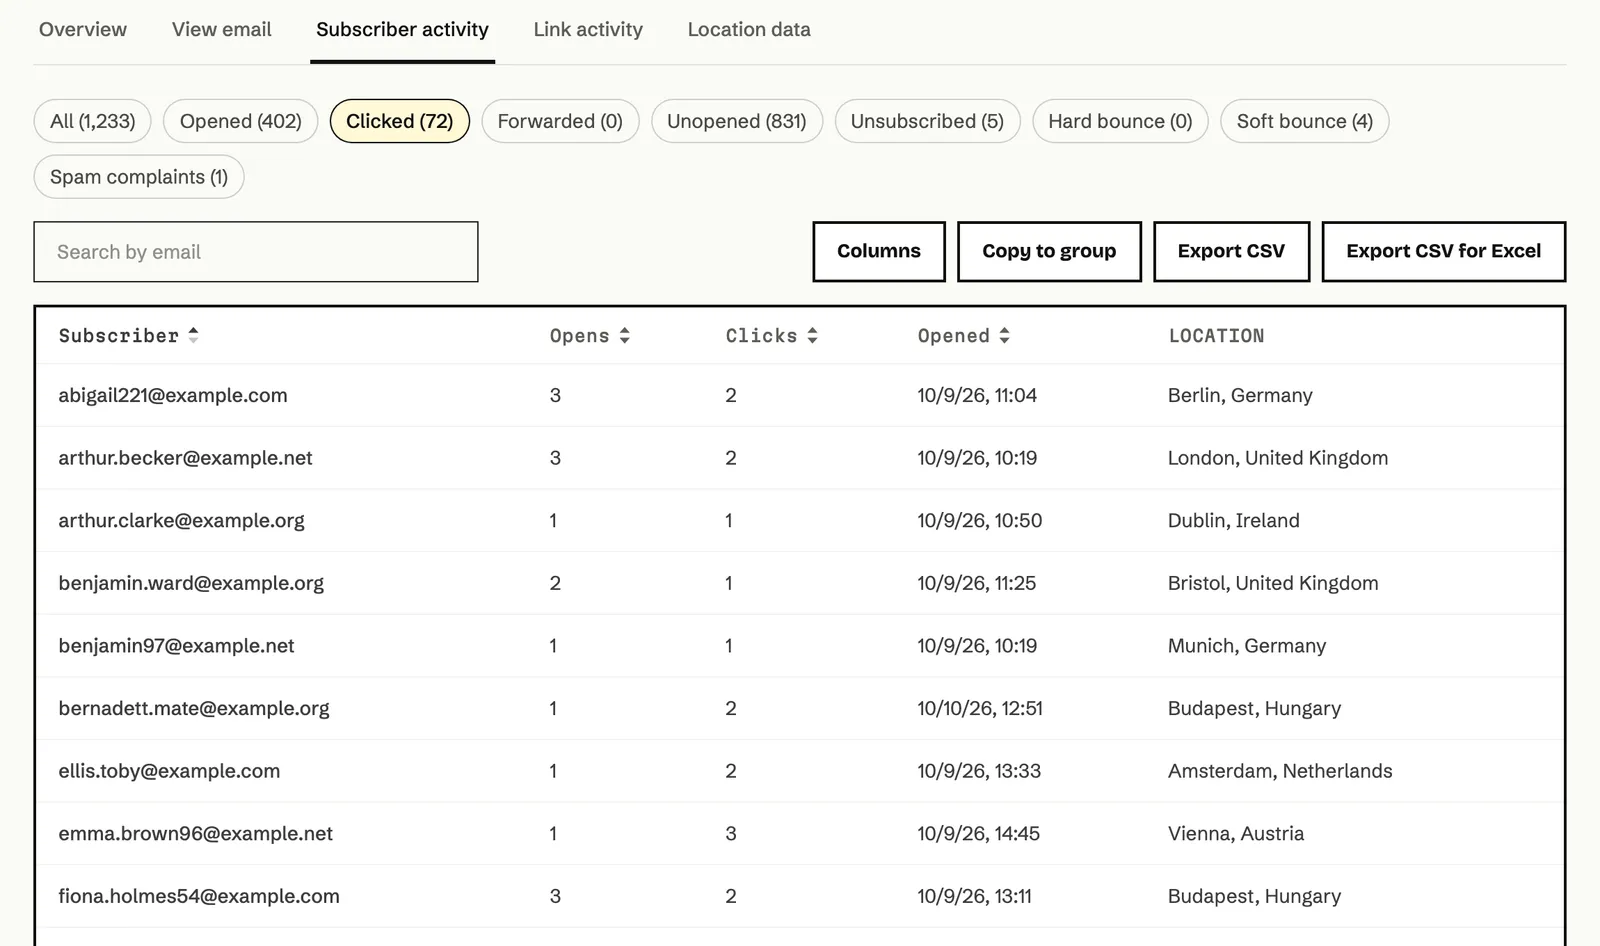
- Click one of the buttons at the top to filter the list: All, Opened, Clicked, Forwarded, Unopened, Unsubscribed, Hard bounce, Soft bounce or Spam complaints. The number in brackets tells you how many subscribers are in it.
- To find one address, type it into the Search by email field.
- Click the Subscriber, Opens, Clicks or Opened column header to sort the list.
Columns and export
Use Columns to choose which details show (for example Status, Sent, Clicked, Location). Your subscriber fields can be columns too. Export CSV and Export CSV for Excel download the subscribers that match the current filter and search, with the columns you chose.
Copy to group
If you want to send the clickers a separate email, put them in a group:
- Pick the filter (for example Clicked).
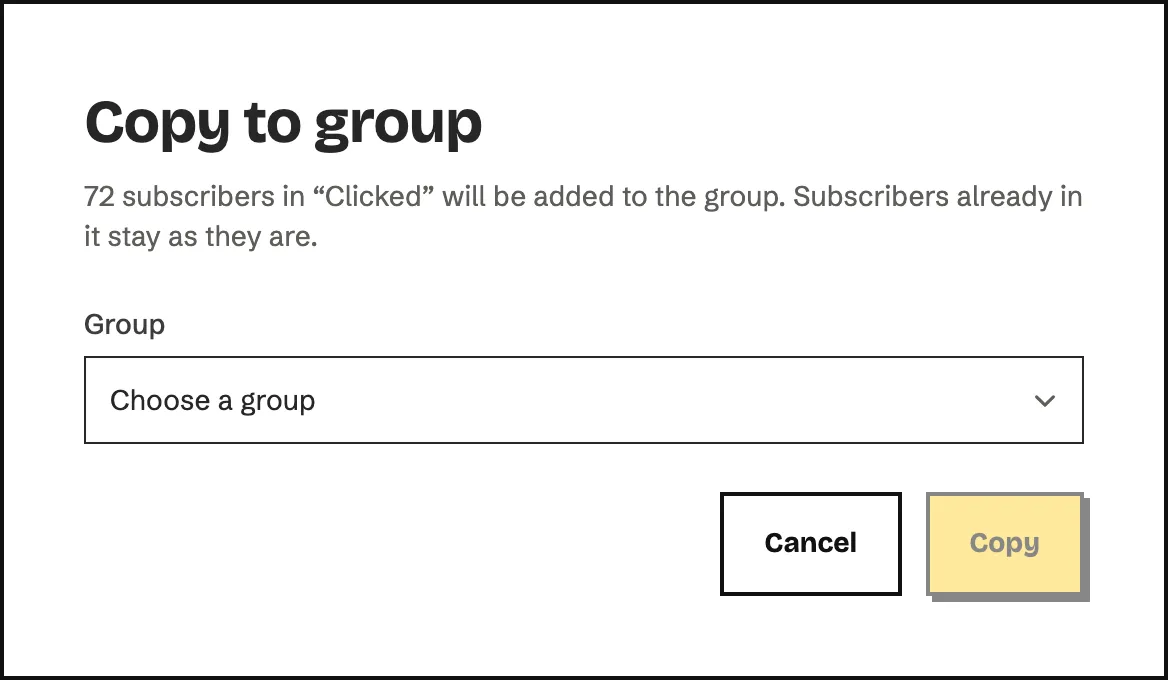
- Click Copy to group.
- Choose the group in the Group list and click Copy.
How to see which links were clicked
Section titled “How to see which links were clicked”-
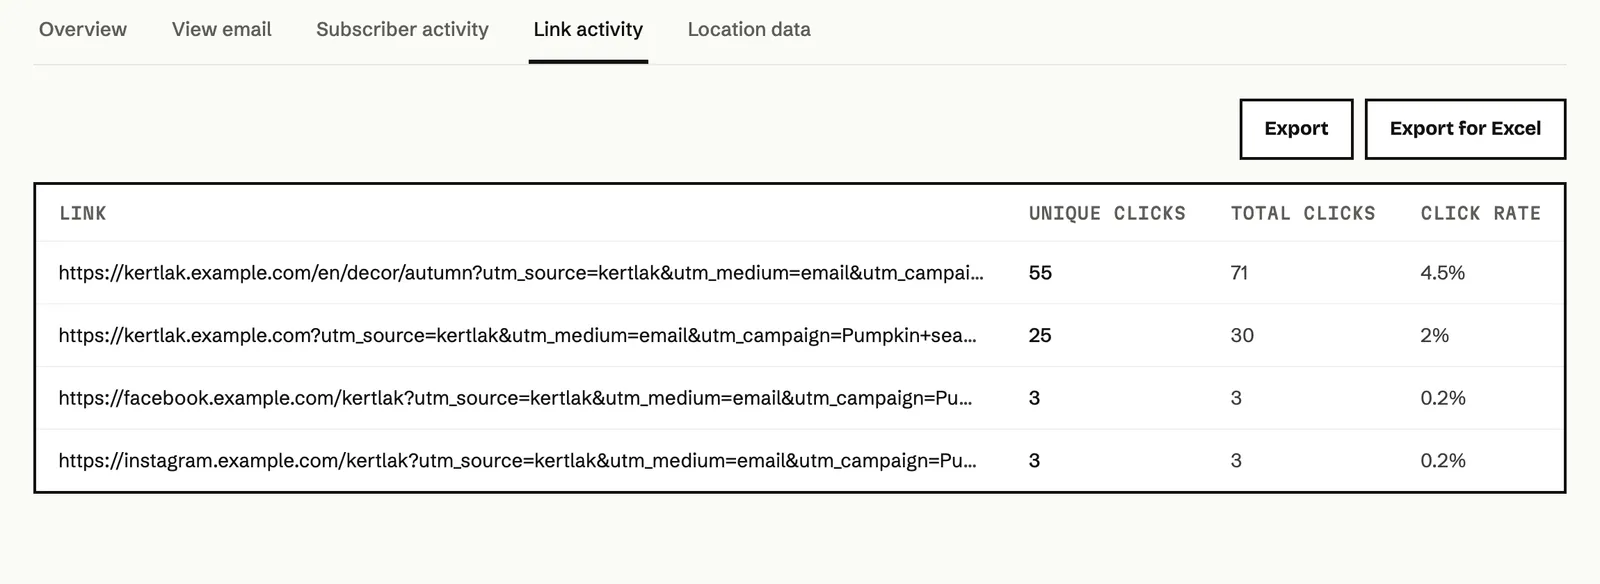
Open the Link activity tab of the report. Every tracked link shows its Unique clicks, Total clicks and Click rate. Here the click rate is the number of people who clicked that link as a share of Total sends.
-
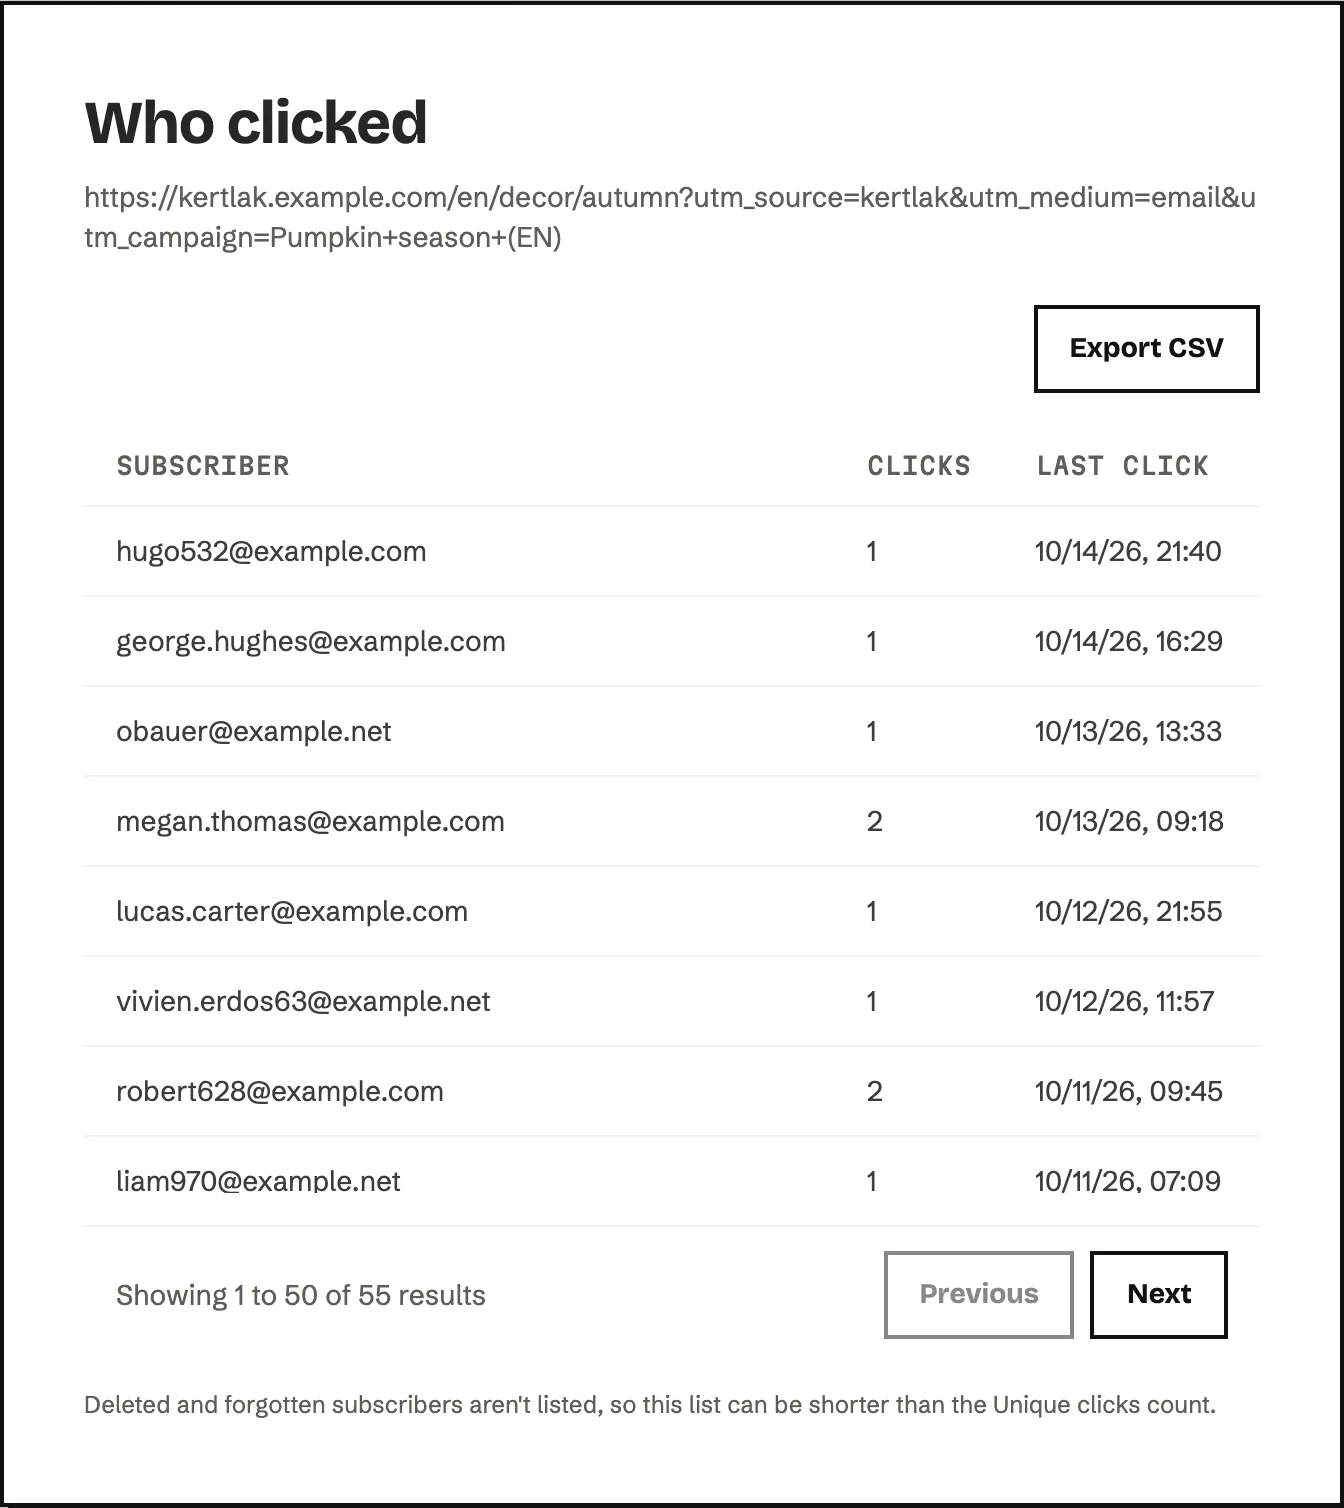
To see who clicked a link, click the number in the Unique clicks column. The Who clicked window opens with the subscribers, their number of clicks and the time of their Last click.
-
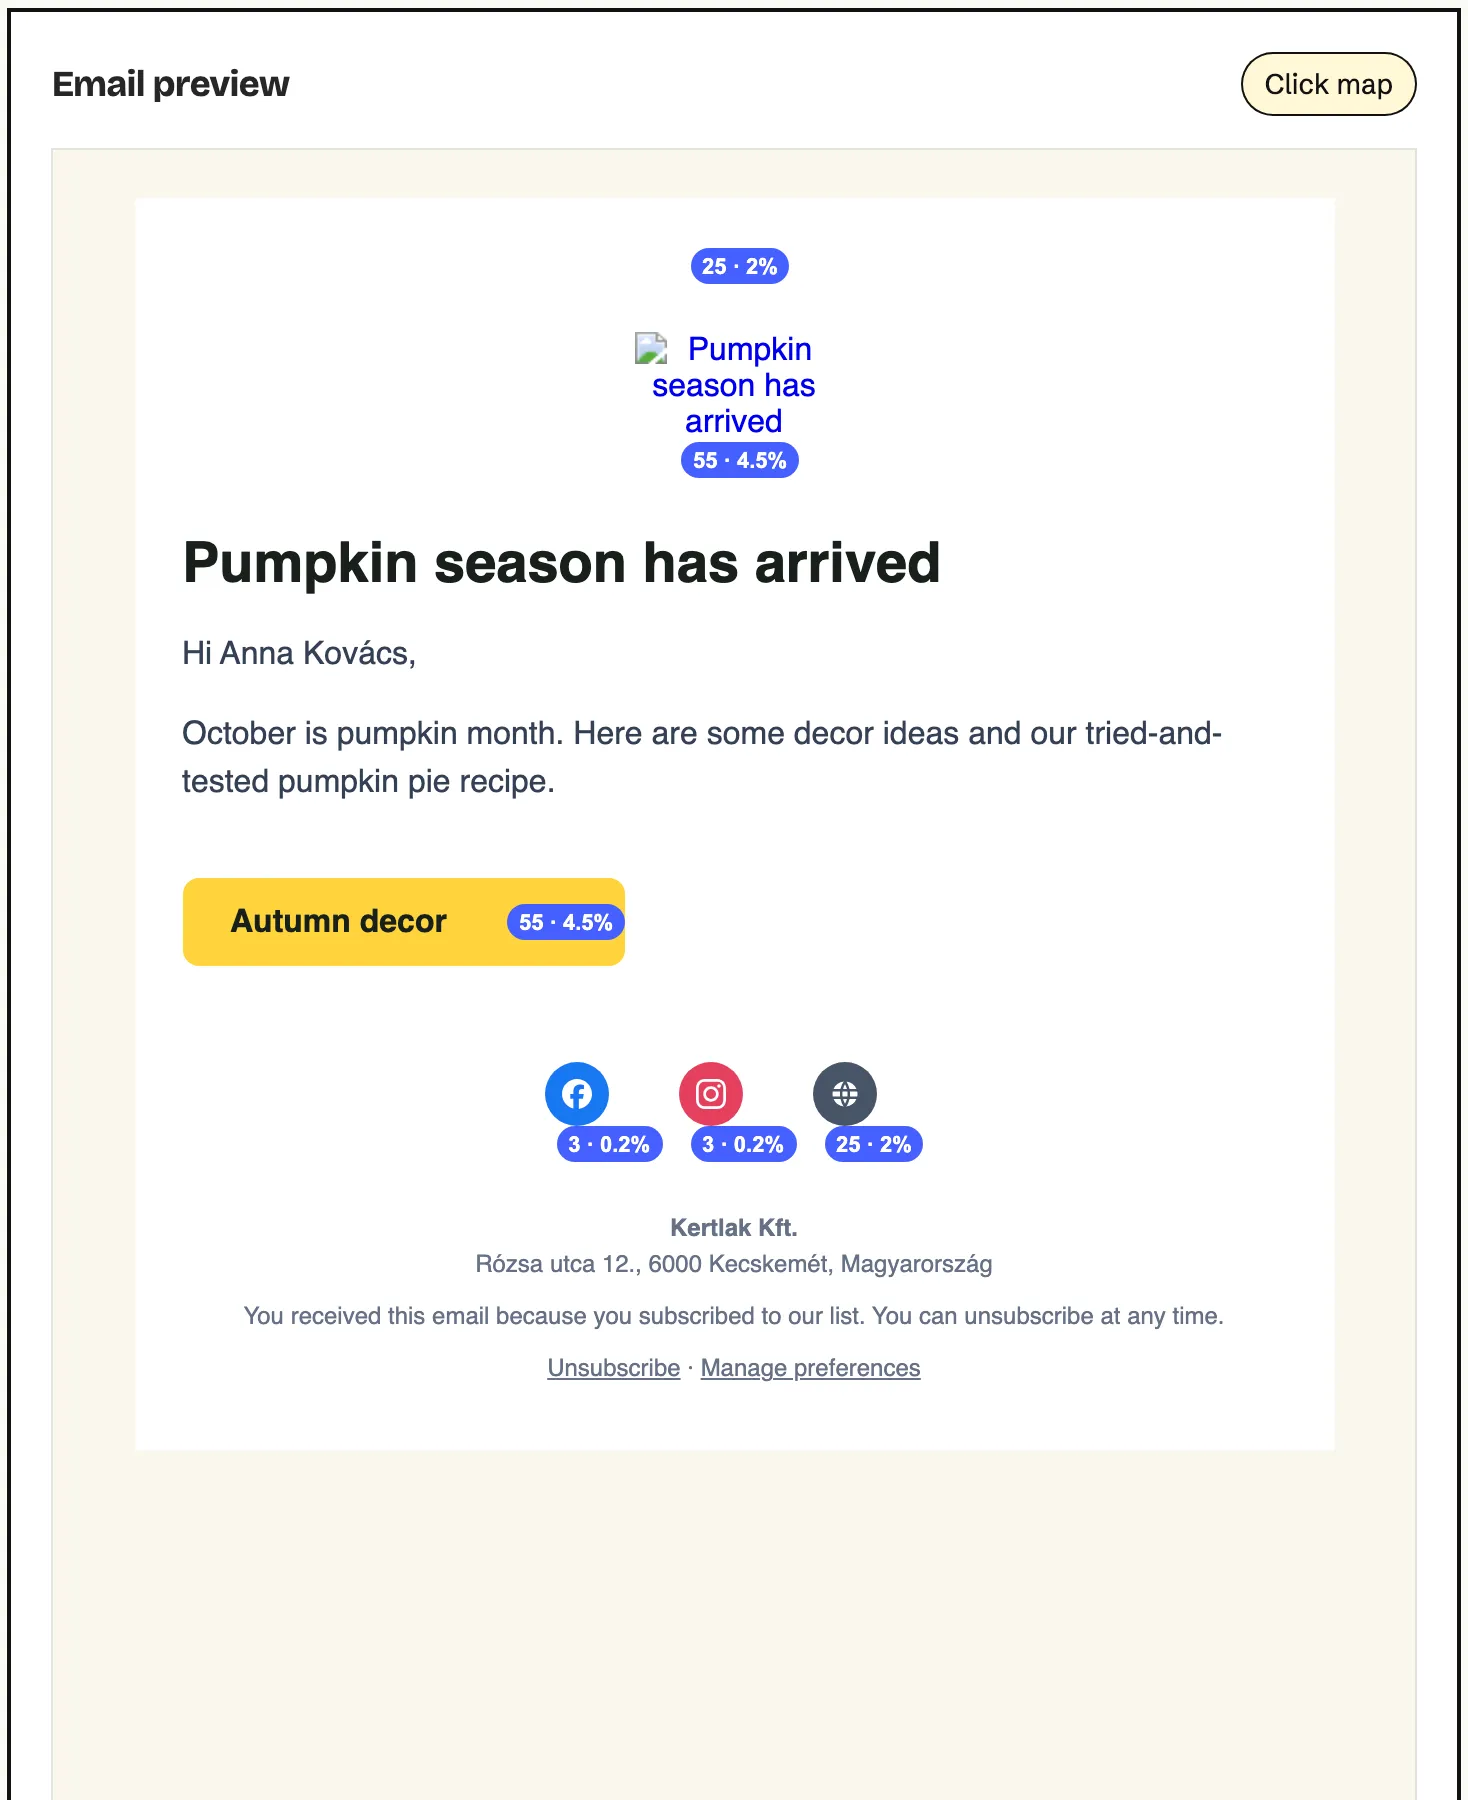
To see on the email itself where people clicked, open the View email tab and click Click map. A label appears next to every link with its unique clicks and click rate.
How to see where the email was read
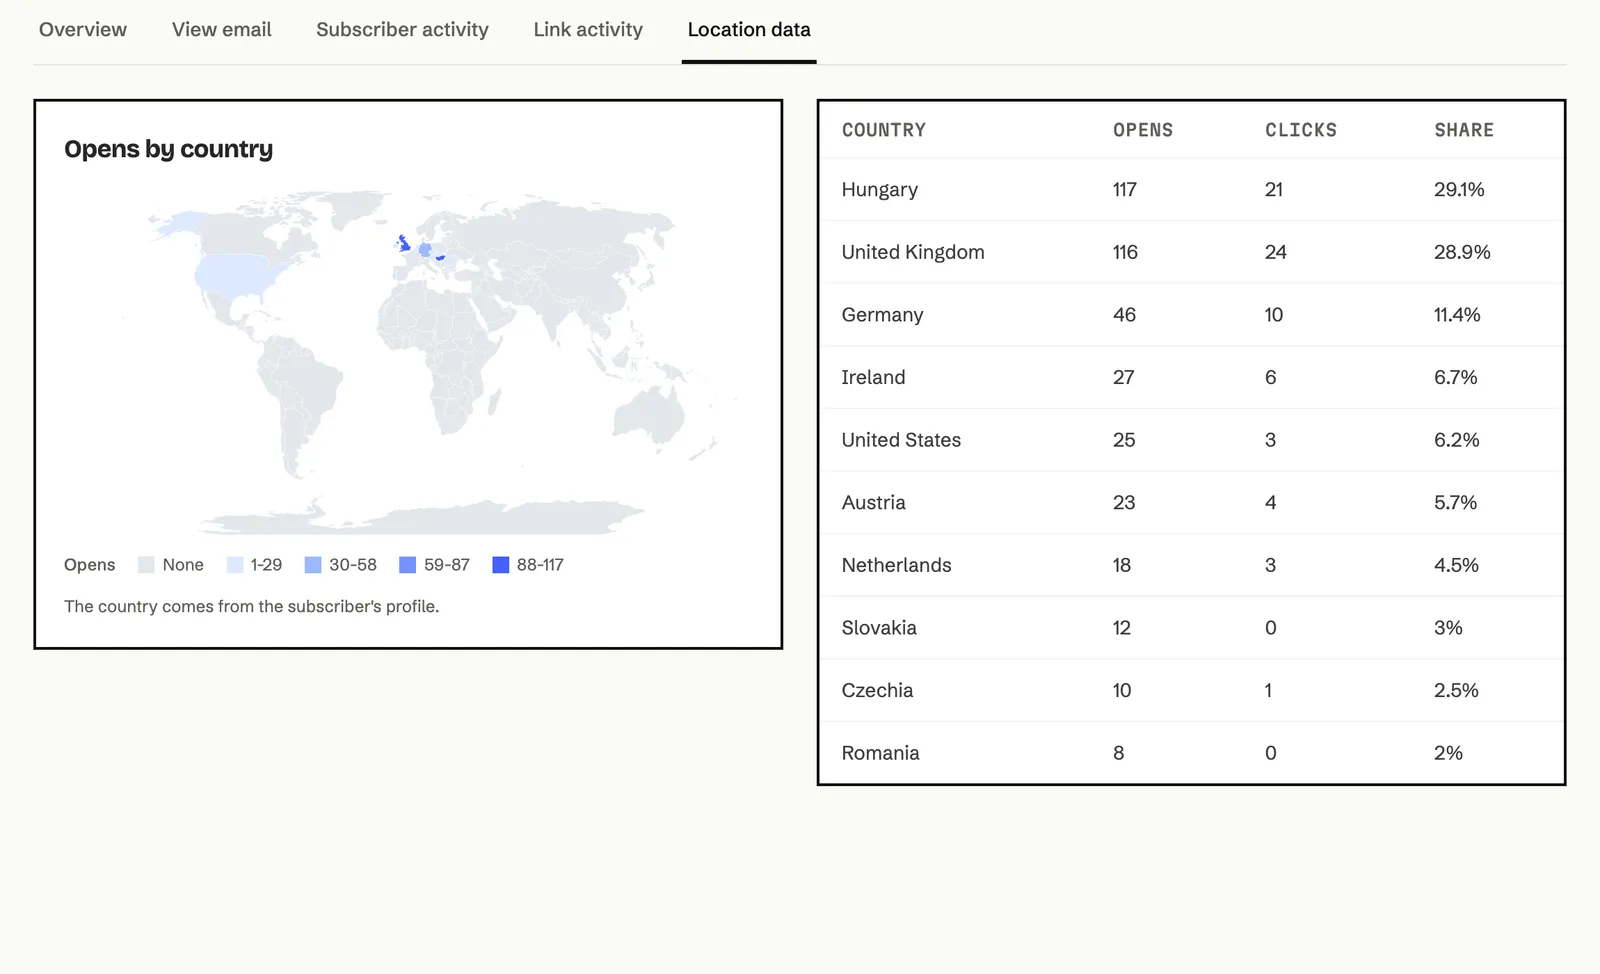
Section titled “How to see where the email was read”Open the Location data tab of the report. On the Opens by country map a darker colour means more opens. Next to it, the Countries table shows opens, clicks and the share of opens for each country.
How to read an A/B test
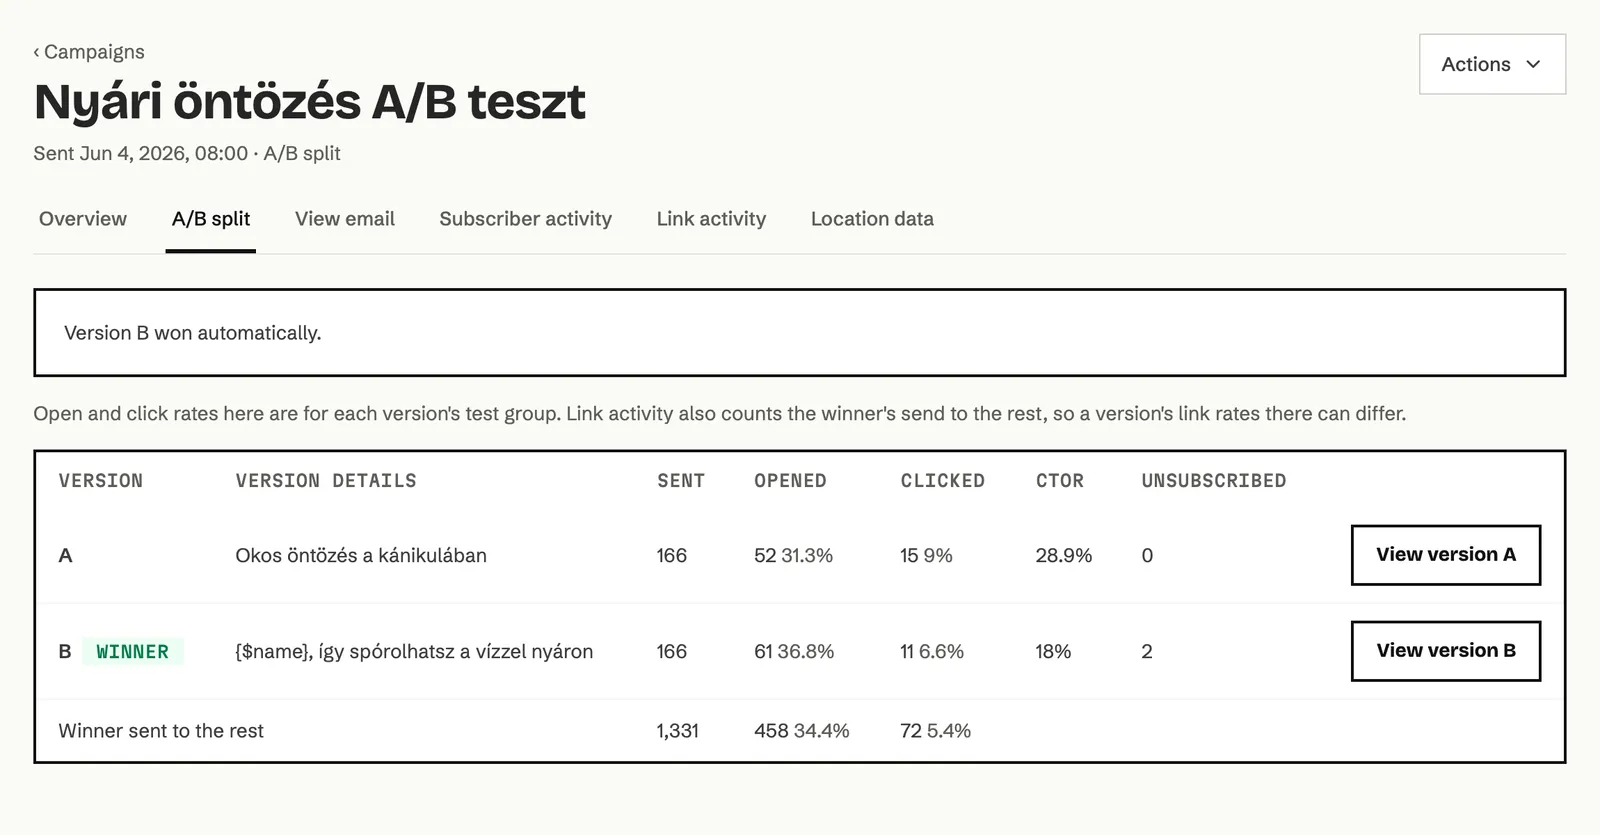
Section titled “How to read an A/B test”An A/B split campaign’s report has its own A/B split tab. In the example, the Nyári öntözés A/B teszt campaign tried two subject lines.
- Open the A/B split tab in the report of the A/B split campaign.
- A sentence at the top tells you where the test stands, for example Version B won automatically.
- The table shows one version per row: Version details says how they differ, followed by Sent, Opened, Clicked, CTOR and Unsubscribed. The winning version has the Winner label.
- The Winner sent to the rest row shows how the winning version did with the rest of the list.
- To see a version’s content, click View version … at the end of its row.
While the test is running
While the test is still running, Pause test stops the automatic choice of the winner, and Resume test starts it again. With Choose as winner you can pick the winner yourself. The rest of the recipients then get that version straight away, and this can’t be undone.
How to see survey, quiz and event answers
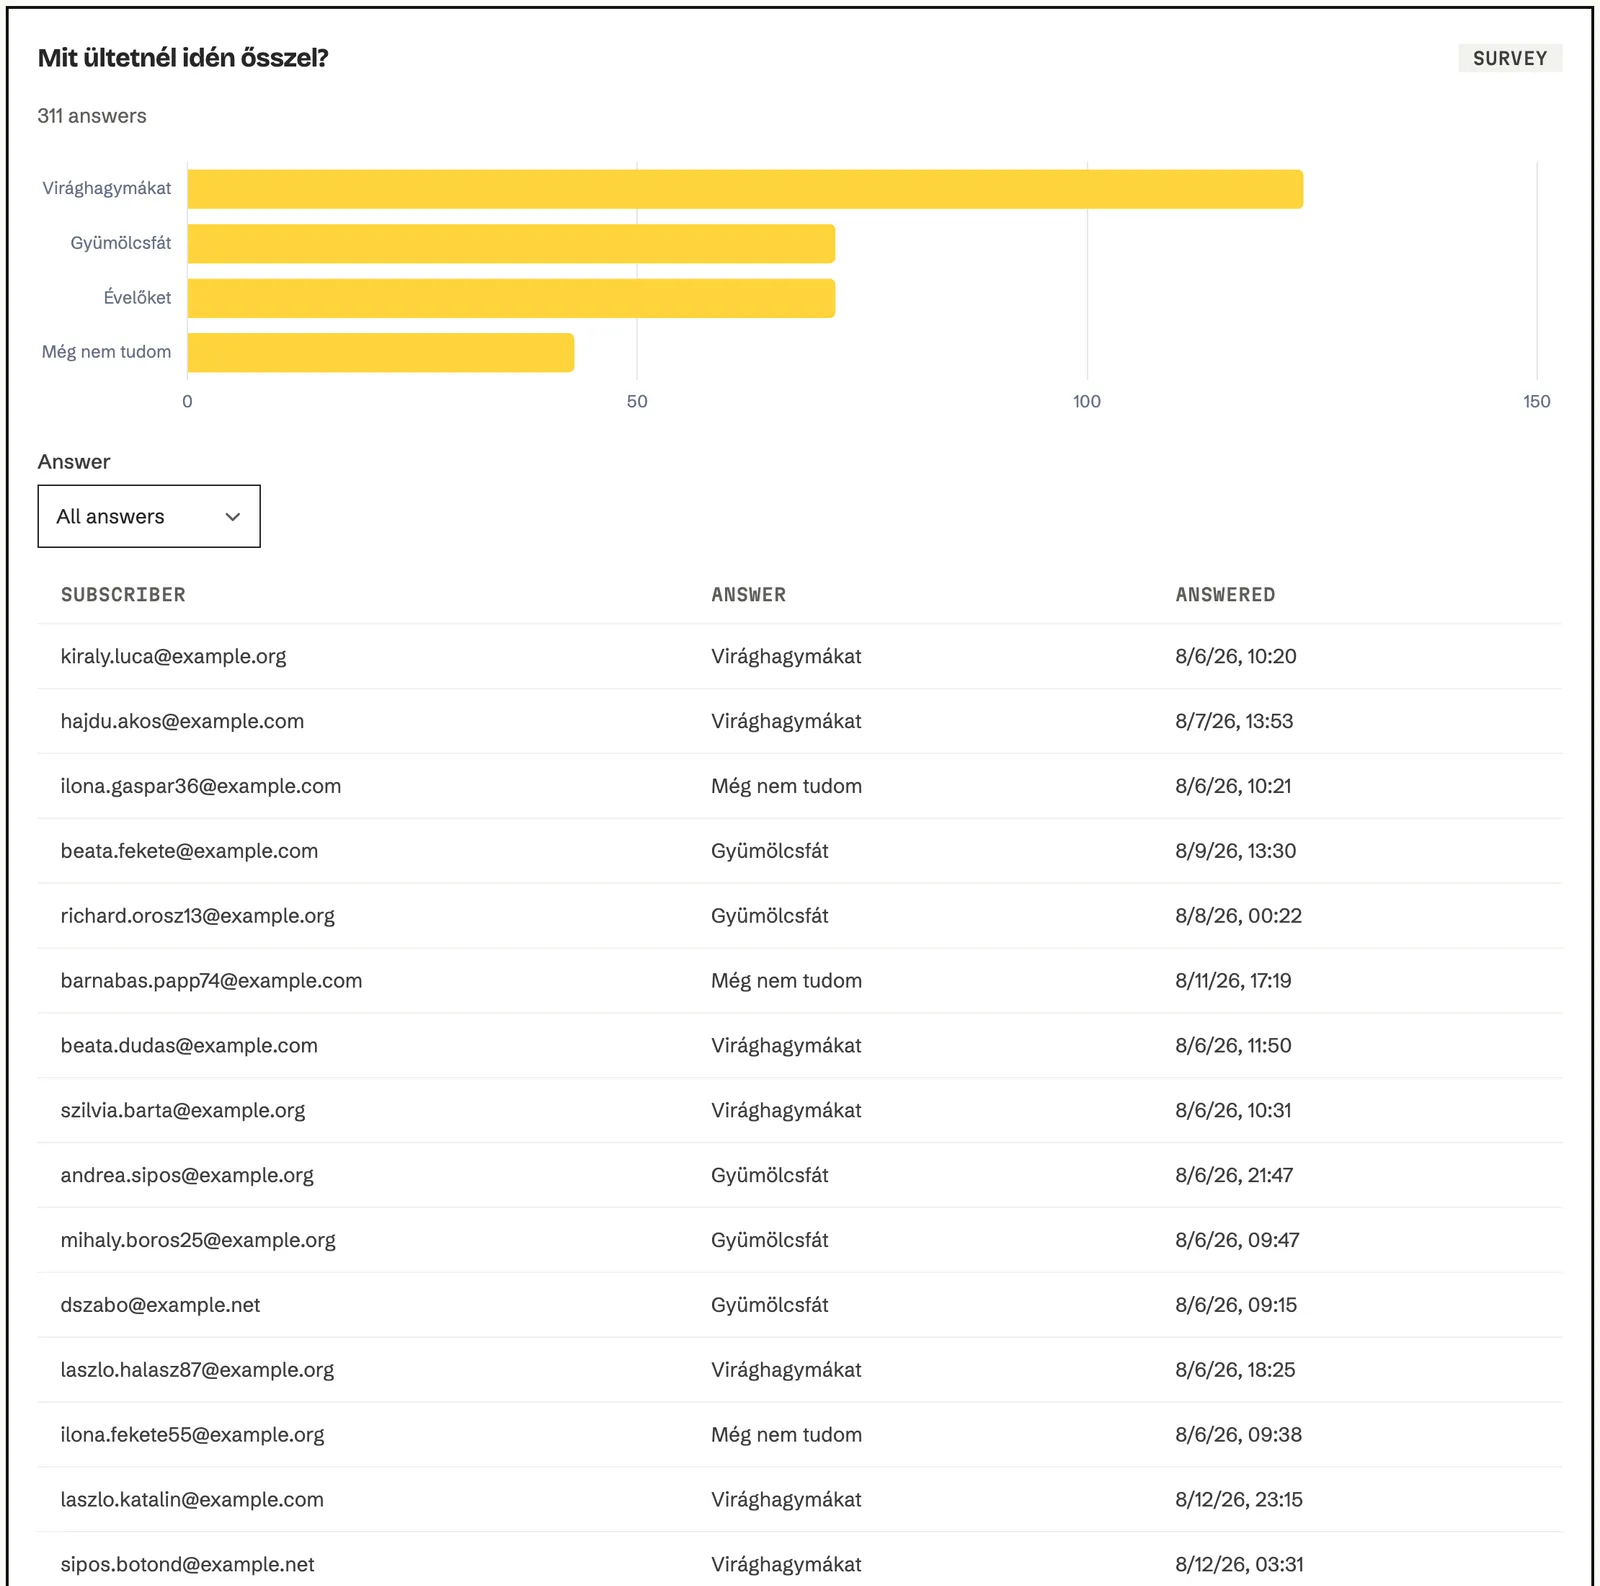
Section titled “How to see survey, quiz and event answers”When the email has a survey, quiz or event (RSVP) block, the report gets a Responses tab. Each block has its own card with the question, its type, the number of answers and a chart.
- Open the Responses tab of the report.
- The chart shows how many times each answer was given.
- To see who answered what, click Respondents. Use the Answer list to filter to one answer, and Load more to load older answers.
- To download every answer, click Export all answers (CSV). The export has everyone who answered the question, whatever the filter.
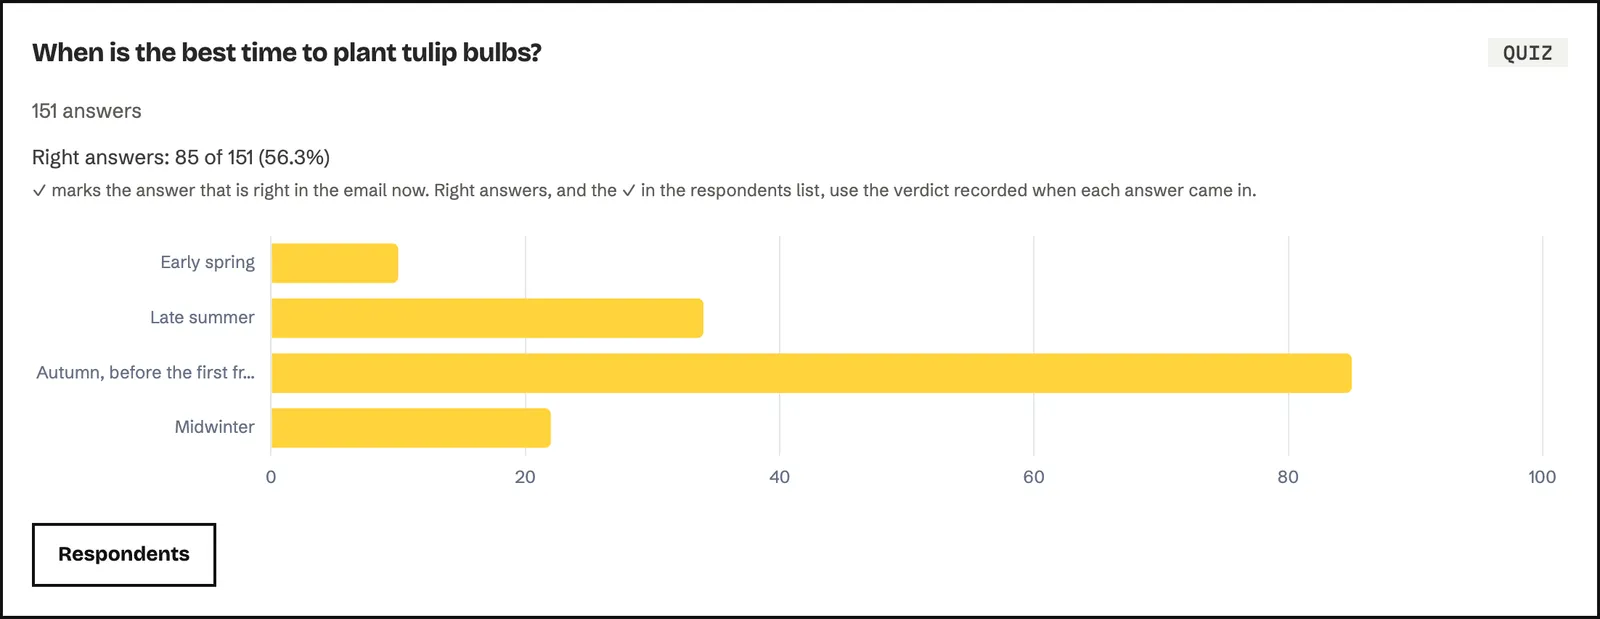
For a quiz, the card also shows how many people answered correctly (Right answers:), and the respondents list marks the right answer with ✓.
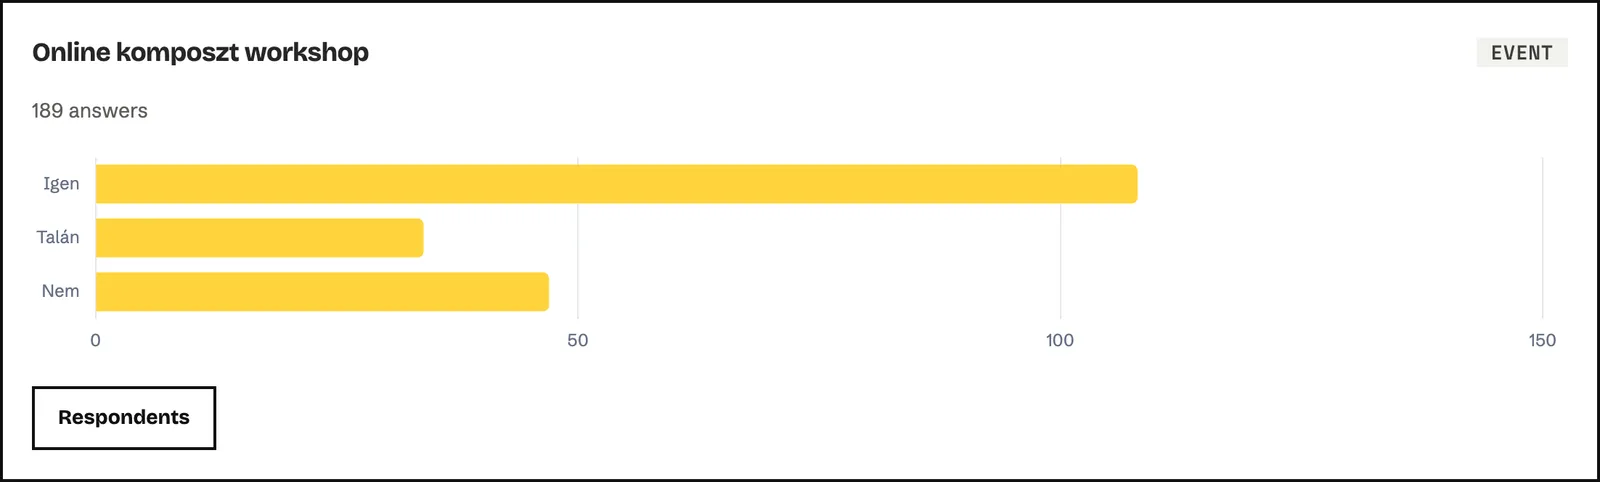
For an event, the answers are the replies to the invitation, in the example the Igen, Talán or Nem (yes, maybe, no) replies to the workshop invitation.
How to download or print a report
Section titled “How to download or print a report”- Open the campaign’s report.
- Click Actions in the top right corner.
- Choose Download report to save the key numbers in a CSV file, or Print to print the open tab (or save it as a PDF from your browser’s print window).
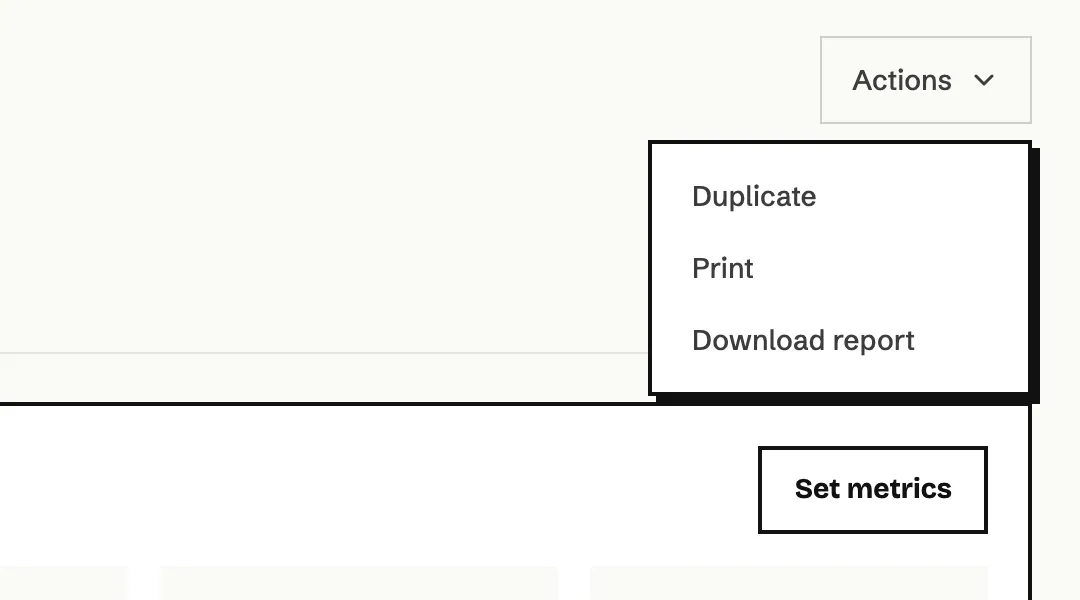
Duplicate creates a copy of the campaign as a draft, for when you want to send a similar email again.
How to create a custom report
Section titled “How to create a custom report”A custom report shows the numbers of several campaigns in one table and chart. You can save its settings and come back later for fresh numbers in one click.
-
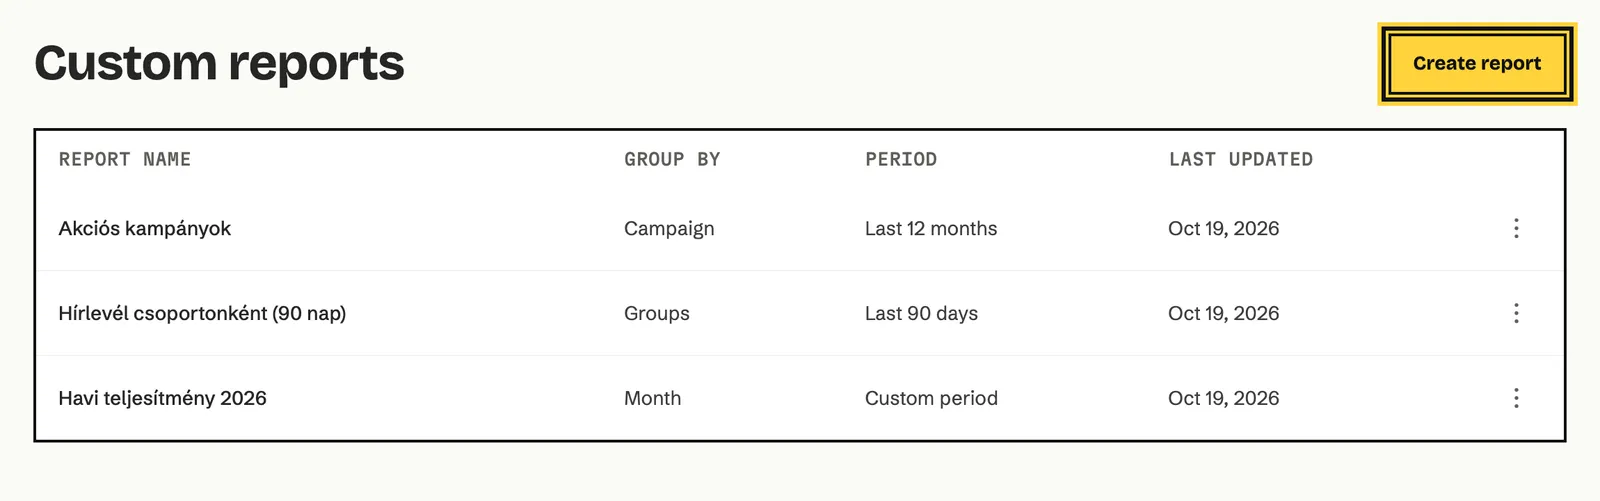
Open the Campaigns page and click Custom reports in the top right corner. This page lists your saved reports.
-
Click Create report.
-
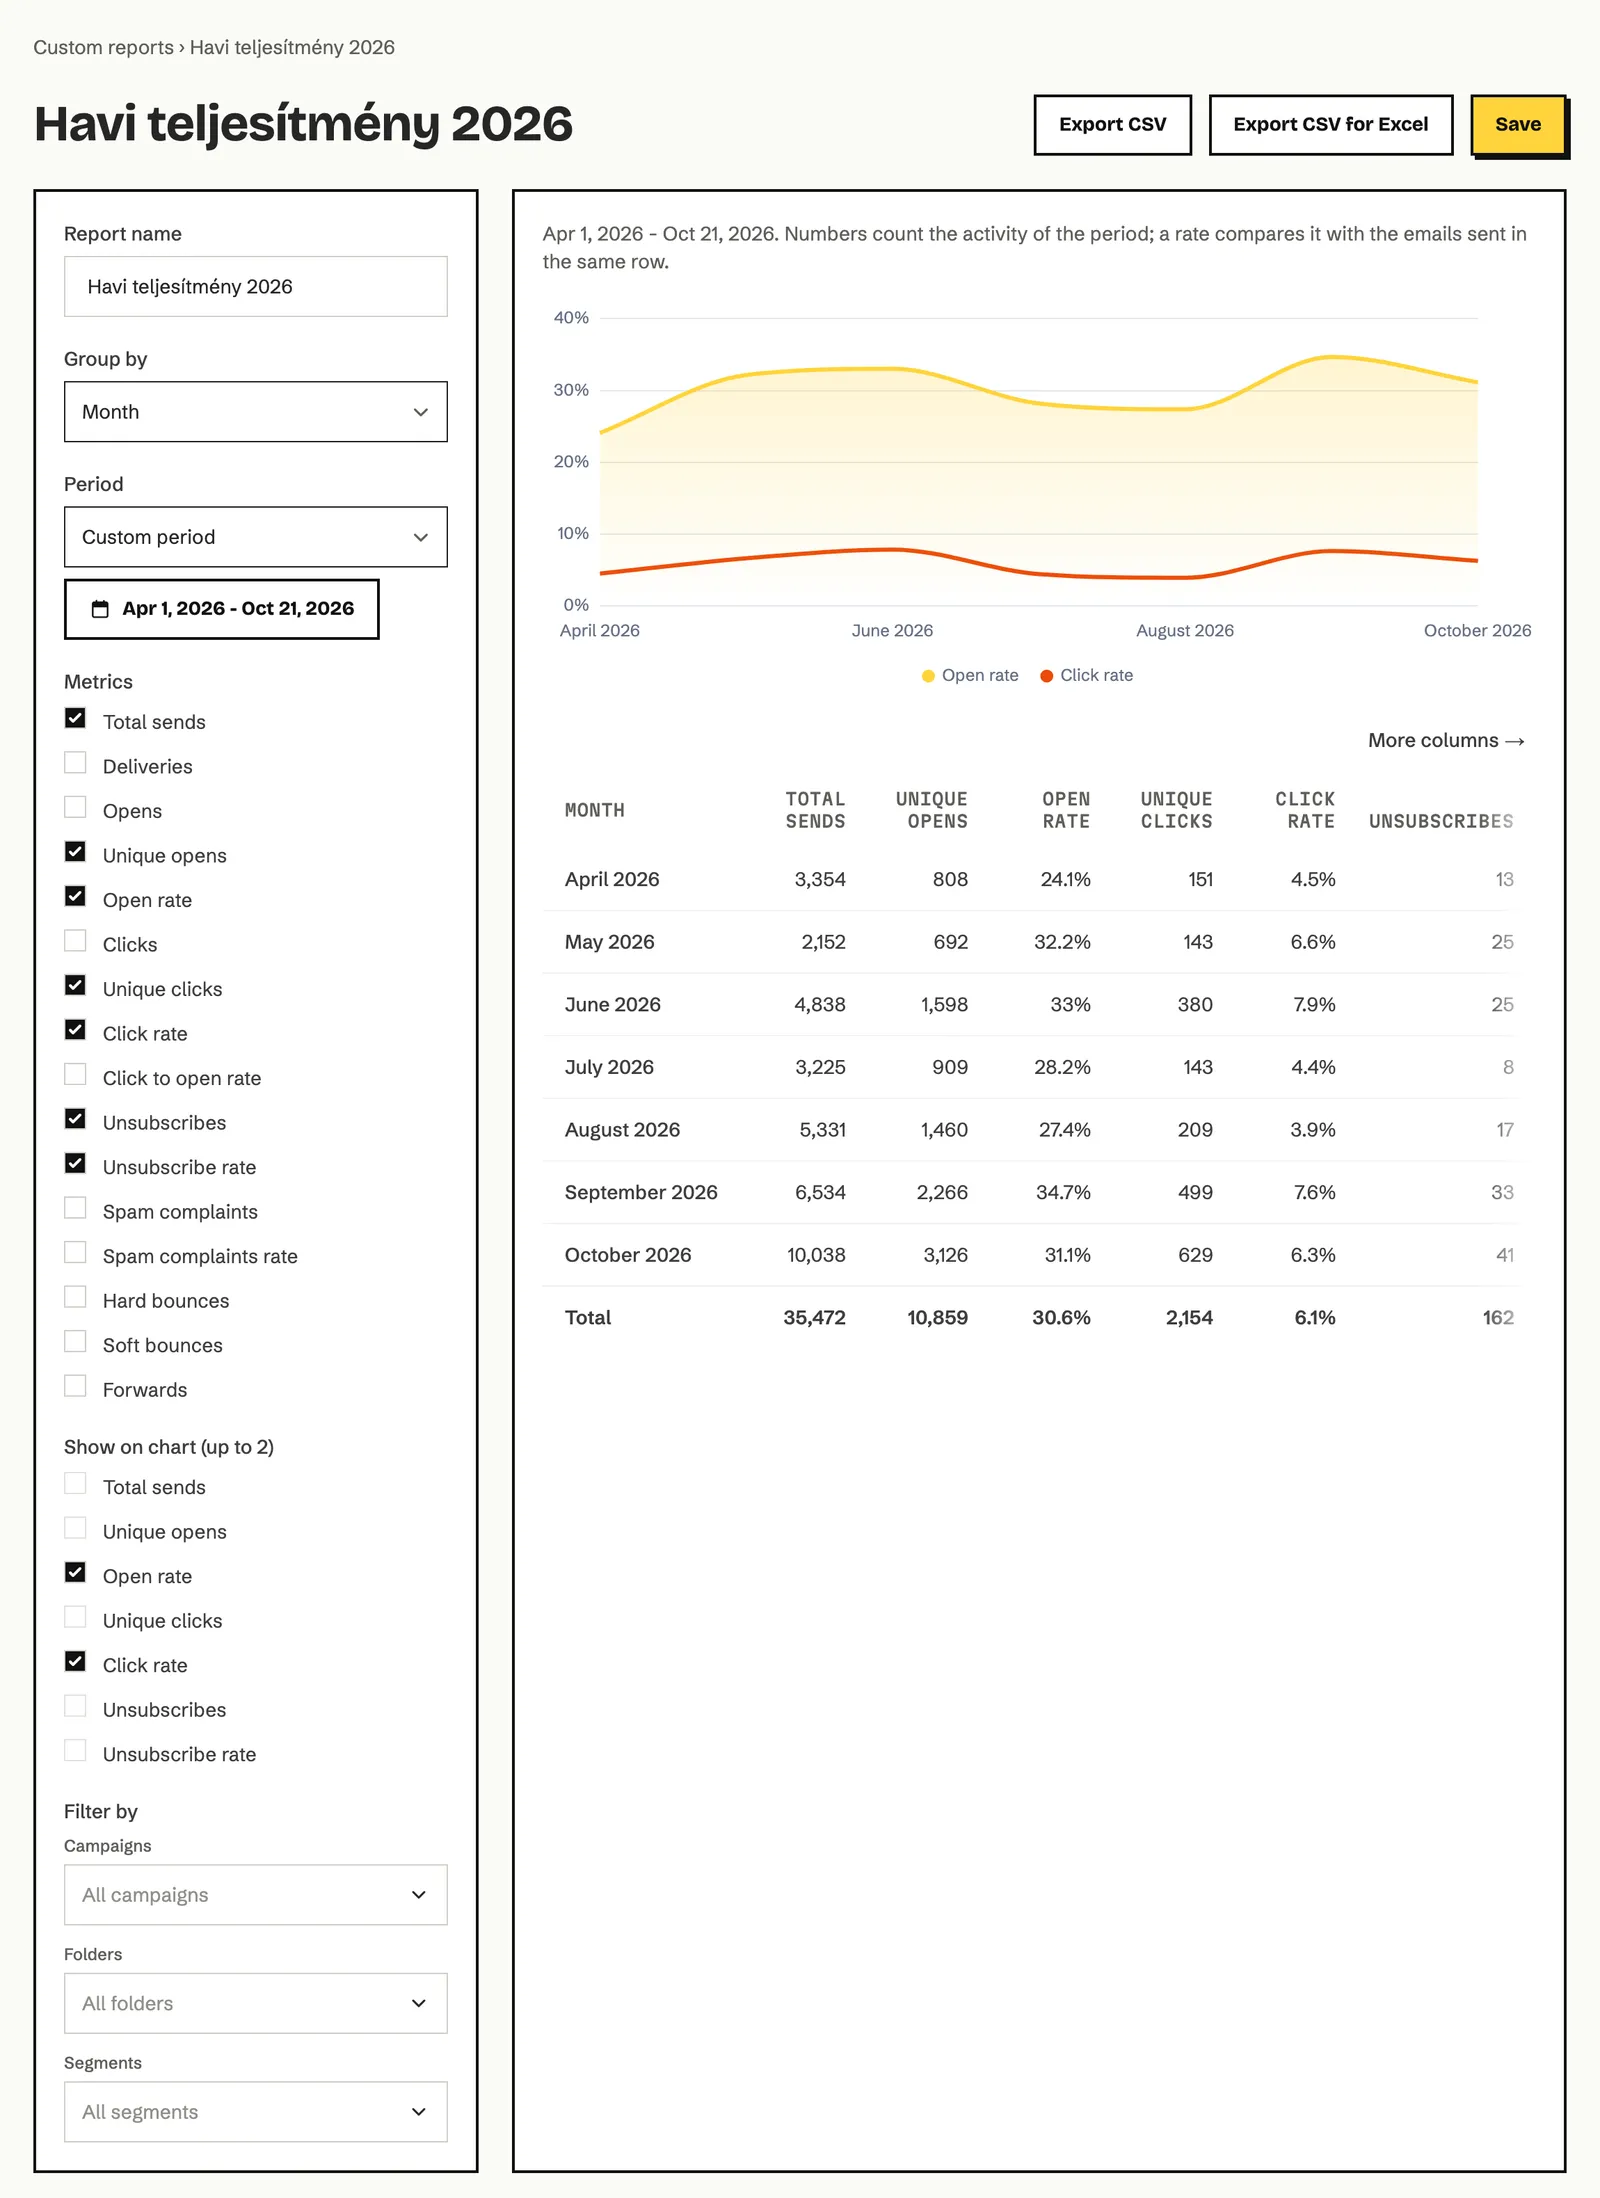
Give the report a name in the Report name field.
-
In the Group by list, choose what one row of the table is: Campaign, Campaign type, Groups, or a period of time (Day, Week, Month, Quarter, Year).
-
In the Period list, choose the period (Last 7 days, Last 30 days, Last 90 days, Last 12 months), or choose Custom period and set the first and last day.
-
Under Metrics, tick the columns of the table. Under Show on chart (up to 2), tick the two that go on the chart.
-
If you only need some campaigns, use Filter by to choose Campaigns, Folders or Segments.
-
Click Save.
The report updates right after every change, so you see the result before you save. Export CSV and Export CSV for Excel download the table.
How to compare campaigns
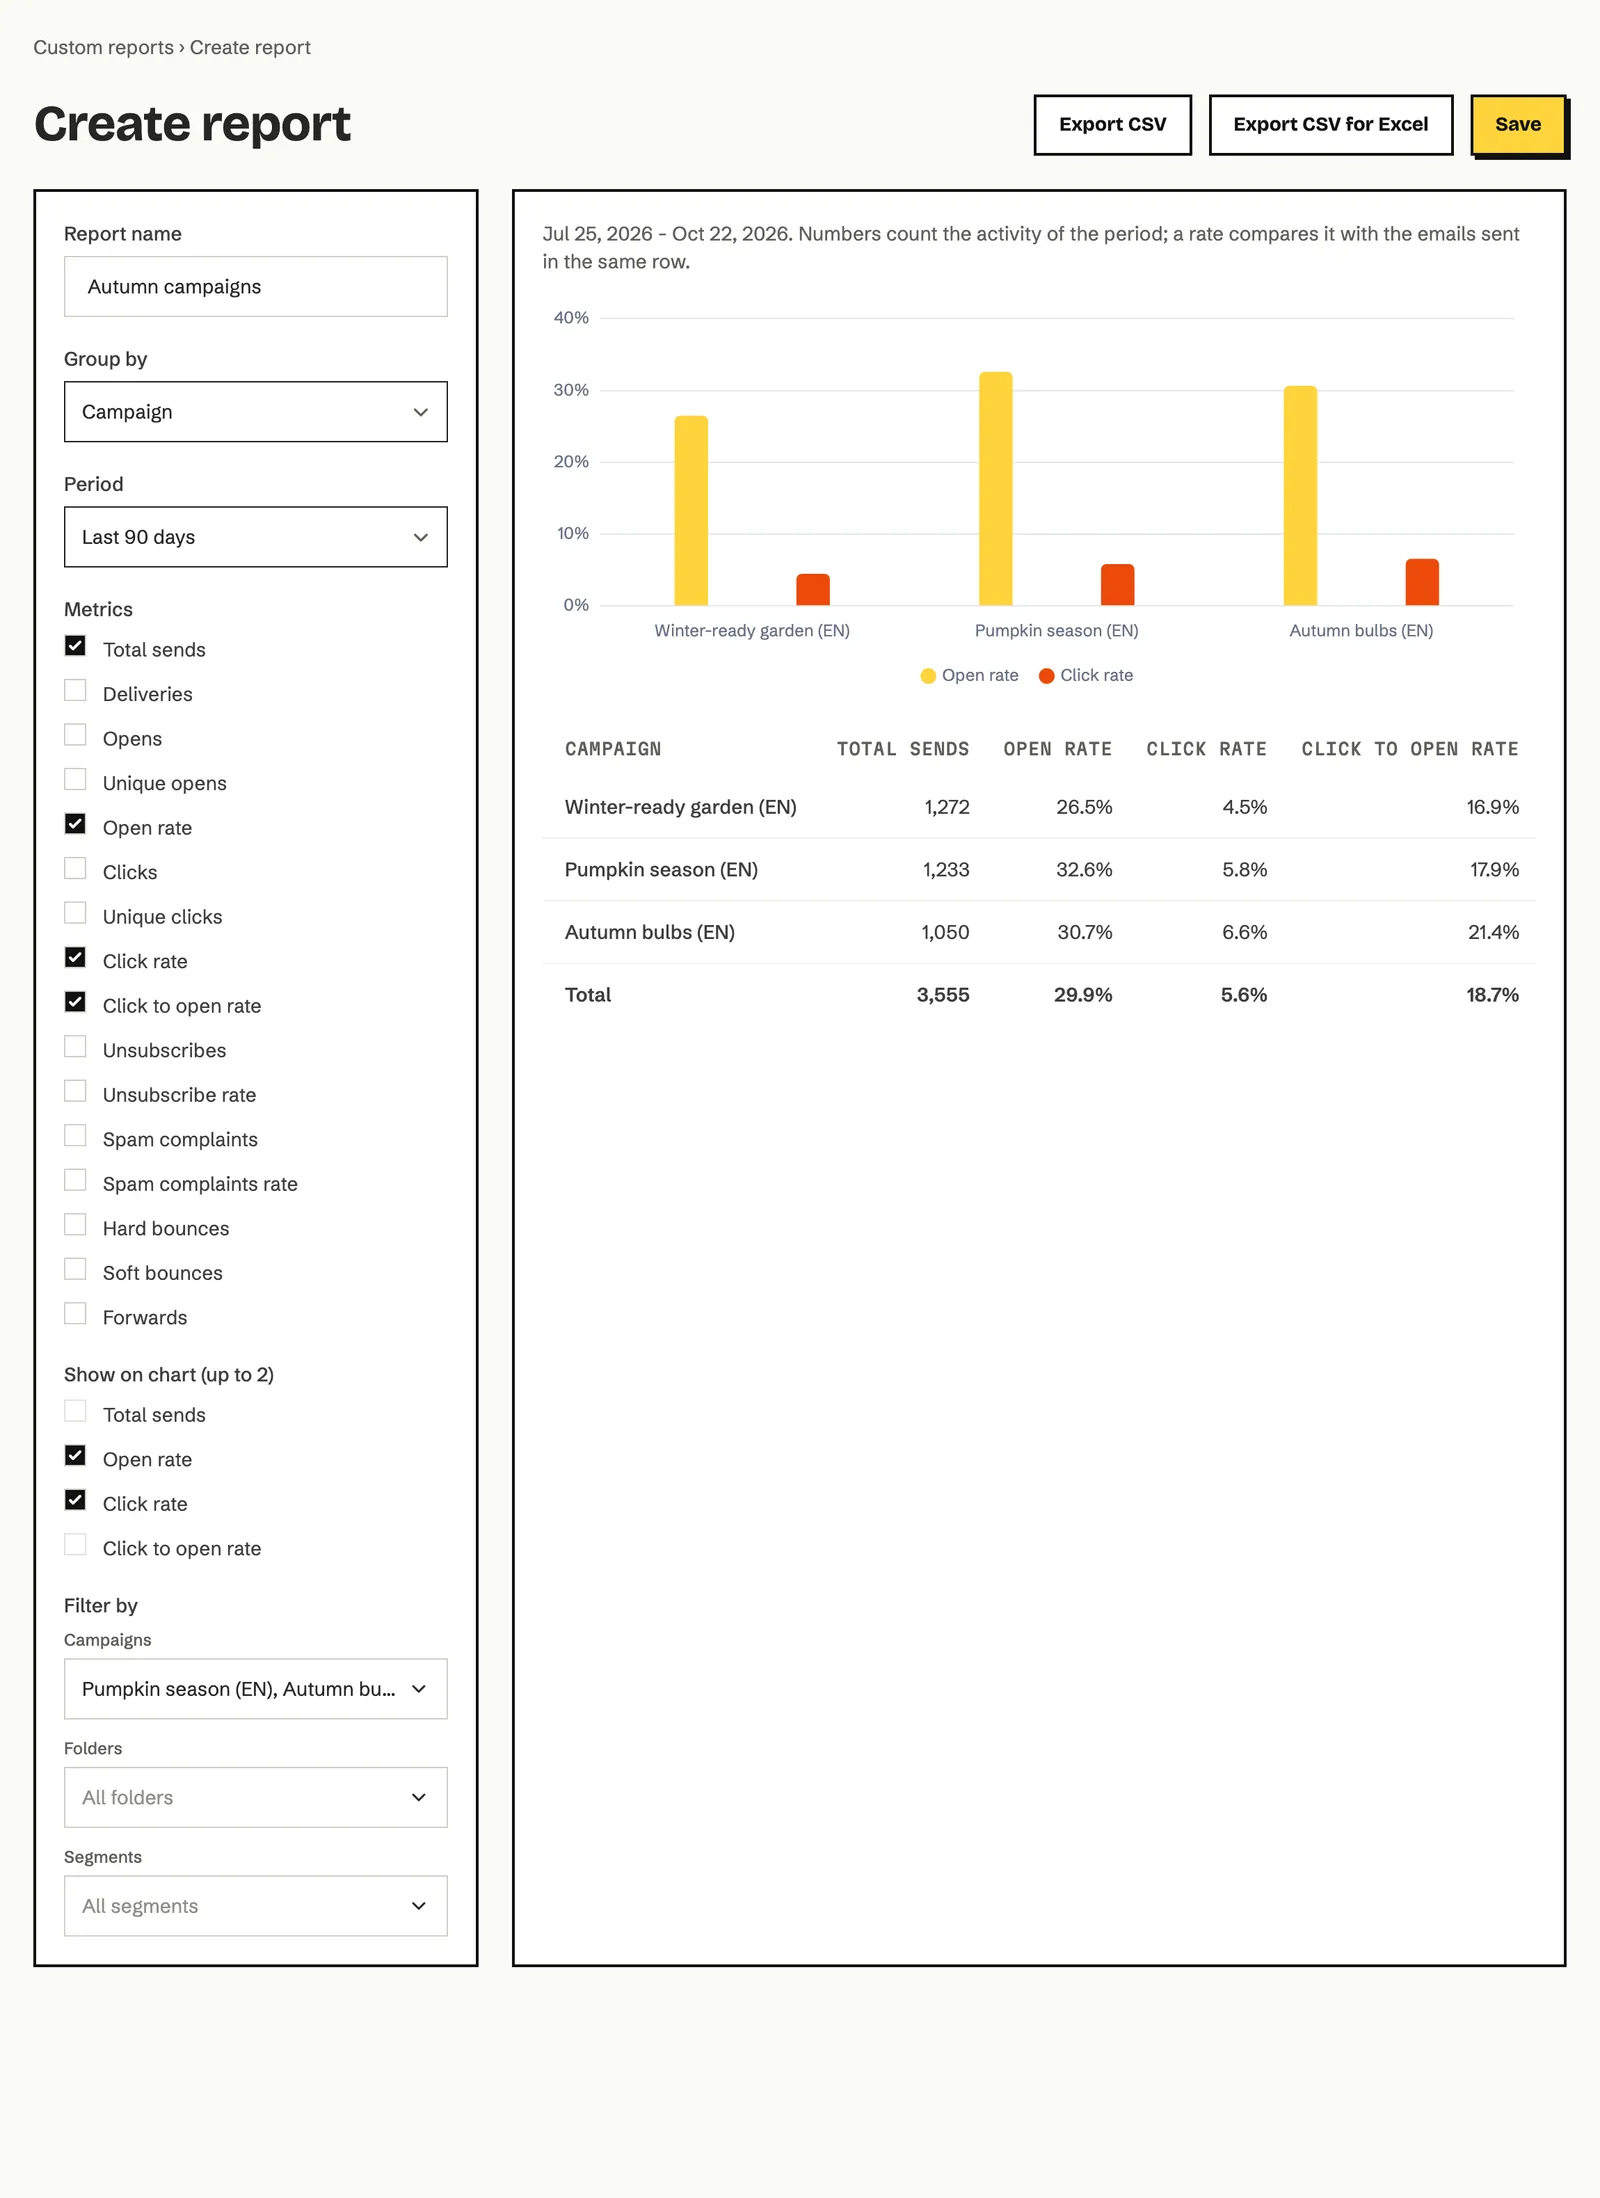
Section titled “How to compare campaigns”To see which campaign did better, group by campaign and filter to the campaigns you want.
- On the Custom reports page, click Create report.
- In the Group by list, choose Campaign.
- In the Period list, choose a period that covers the campaigns, for example Last 90 days.
- Under Metrics, tick what matters for the comparison, for example Open rate, Click rate and Click to open rate.
- Under Filter by, open the Campaigns list and tick the campaigns. The Search campaigns field finds them by name.
- If you’ll need it again, click Save.
Why is my open rate different from another tool’s? Echo compares openers with the emails that actually went out (Total sends) and counts each subscriber once. Other tools may compare with delivered emails or count every open, so the rates can differ.
Is Apple Mail inflating my open rate? Apple Mail’s privacy feature can download emails on the recipient’s behalf, and these count as opens. On the Overview tab, the Unknown bar of the Reading environment card shows how many such opens there were. For a firmer signal, watch the Click rate and the Click to open rate.
Why is the number on the Subscriber activity tab lower than on the Overview? Deleted and forgotten subscribers aren’t listed there, but they still count in the campaign’s numbers.
How can I email only the people who clicked? On the Subscriber activity tab, choose the Clicked filter and use Copy to group to put them in a group. Then send a campaign to that group as described in the Campaigns chapter.
Can I share a report with someone who has no access? Reports have no public link. Download it with Download report in the Actions menu, or save a PDF with Print. If a teammate needs it regularly, ask the workspace administrator to invite them, for example with the Viewer role.